Running your Shopify store without understanding customer behavior, market trends, and website performance can lead to missed opportunities and slowed business growth. Luckily, with Shopify Analytics, valuable knowledge is just several clicks away.
Shopify offers a suite of built-in analytics tools for sales, revenue, customer behavior tracking, and marketing and inventory insights. While indispensable for improving your store’s performance, interpreting these numbers and reports can be challenging.
Don’t worry, though. GenovaWebArt is here to explain how to use Shopify Analytics for business. After helping over 200 clients (including MìLà and Early Rider) master Shopify development, we’re well-equipped with actionable strategies, key metrics, and practical tools.

Table of Contents
Understanding Your Shopify Analytics Data
Shopify Analytics tools let you access lots of information. But focusing on the right info is the key to data-driven business decision making. Let’s look at the main metrics you can track and see how you can use them to increase sales, improve customer experience, and optimize your online store:
Key Metrics to Analyze
The Shopify Analytics dashboard provides numerous metrics on your store’s performance and traffic behavior. But the most valuable ones are:
- Profit. It’s your total income generated from sales. Shopify offers an in-depth outlook on your costs, margins, and revenues through Profit reports. Tracking these metrics lets you measure your overall business performance and find areas for improvement.
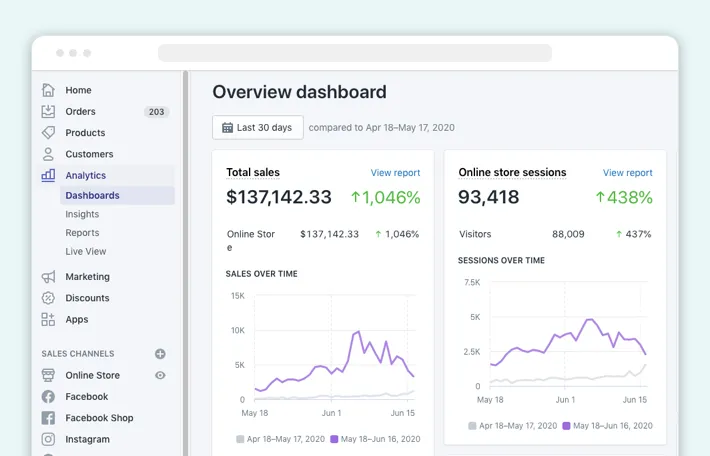
- Traffic. It allows you to see how many visitors your store gets.
Shopify provides insights into online store sessions by such traffic sources as search, direct, social, and email. The platform also lets you track sales by specific traffic sources. Analyzing this metric is crucial for optimizing your Shopify marketing strategies and reducing bounce rates.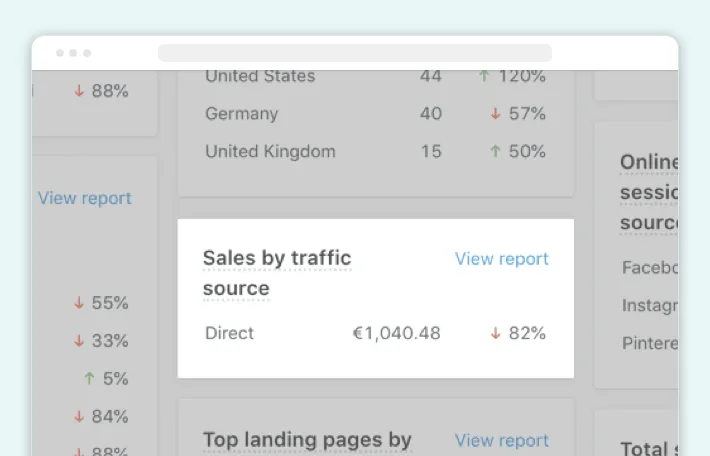
- Average order value (AOV). This metric shows the average amount spent per order. It’s calculated by dividing the total value of all orders by the total number of orders. Increasing AOV can significantly impact your bottom line. You can do this through upselling, cross-selling, or product bundles.
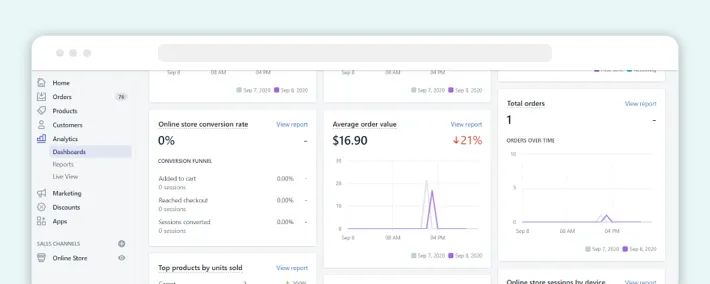
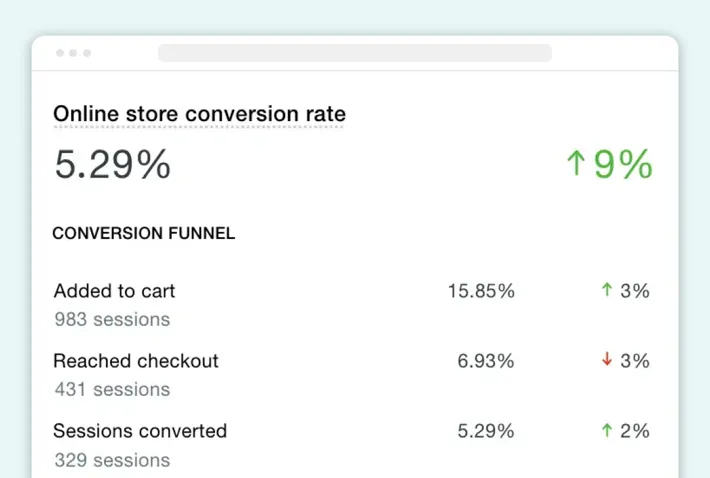
- Conversion rate. It shows the percentage of visitors who complete a desired action in your store. Shopify data analytics lets you track conversion at the three crucial stages of a buyer’s journey: added to cart, reached checkout, and sessions converted. Monitoring Shopify conversion rate allows you to analyze drop-off points and take appropriate measures to improve user experience and checkout.
- Customer acquisition cost (CAC). It shows how much, on average, it costs to get a new customer. To find a CAC, divide all sales and marketing costs by the number of new customers acquired in a given time. Analyzing this metric helps you evaluate the effectiveness of marketing strategies and optimize expenses.
- Lifetime value (LTV). This metric estimates the total revenue a customer is likely to generate throughout their relationship with your store. Focusing on customer retention and improving LTV leads to sustainable e-commerce business growth.
Navigating Shopify Analytics
The Shopify Analytics dashboard is a central hub for tracking your store’s performance. It lets you view metrics across various categories like sales, orders, visitors, customer behavior, and beyond. Handling e-commerce data analysis with this tool empowers you to optimize your store for success.
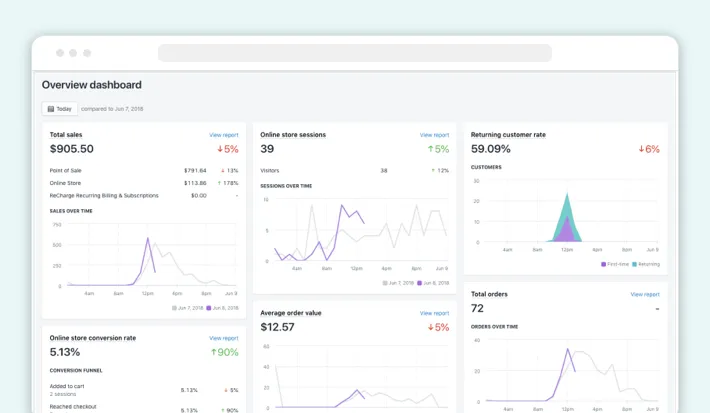
As you open your Shopify admin and go to the Analytics page, you see a pre-selected set of metrics — a quick snapshot of your store’s health for today compared to yesterday. However, you can broadly categorize the metrics into the following sections:
- Sales. Shopify sales analytics with metrics like average order value, total sales, top-selling products, and more.
- Acquisition. Sources of your website traffic and top landing pages by sessions.
- Orders. Number of orders, fulfillments, and returns.
- Finances. Insights on your sales, payments, liabilities, and gross profit.
- Behavior. Online store conversion rate, checkout conversion, bounce rate, and other metrics on customer behavior.
- Customers. The number of customers over time and returning customer rate.
- Inventory. Products by sell-through rate, average inventory sold per day, ABC product analysis, and more.
- Marketing. Sales attributed to marketing, referrers, interactions, and other metrics.
You can generate a default report for each of the above sections. But guess what? If you leverage the Advanced Shopify or Shopify Plus plan, you can take analytics to a new level — creating custom reports. Just use Shopify’s filtering and editing features to personalize your reports. That’s the way to see exactly the data you require.
Besides just that, you can enhance your Shopify Analytics setup with advanced features. Some of the possible ones are:
- Data export. Leverage Shopify to export your analyzed data in various formats like CSV or XLSX for further analysis in external tools.
- Google Analytics integration. Install Google Analytics on Shopify for deeper insights into visitor behavior, traffic sources, and audience demographics.
- Facebook Pixel integration. Integrate Facebook Pixel if you use Facebook Ads for marketing purposes. Leverage this tool to optimize your campaigns, retarget website visitors, and ensure the cost-effectiveness of your ads.
Interpreting the Data
So, you’ve explored the information in Shopify Analytics. Now, it’s time to interpret the data into actionable insights. Here’s what you can do:
1. Spot Trends and Patterns
First of all, it’s always best to look for consistent changes over time. Are your sales steadily increasing, or is there a seasonal peak? Monitor upward and downward trends in metrics like profit, traffic, or customer acquisition to jump into predictive analytics and adjust your strategies.
It’s also important to compare your data in different periods. This method works well for metrics like conversion rate or bounce rate.
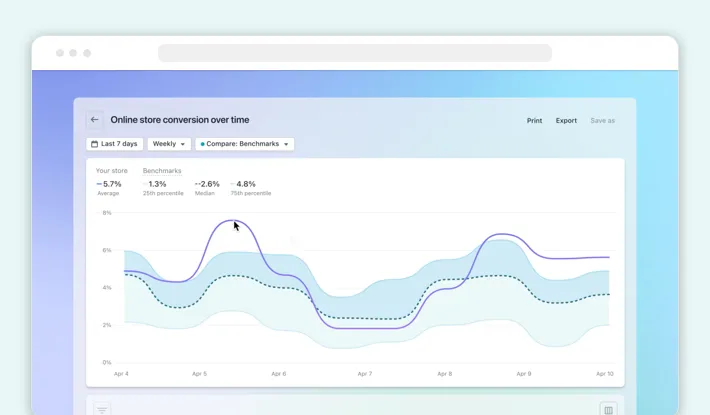
On top of that, look for connections between different metrics. For example, a sudden spike in website traffic might coincide with a recent social media campaign launch. Track such things to understand the cause-and-effect relationships impacting your business.
2. Identify Anomalies
Next, you want to identify data that significantly differs from what you expected. For example, a sudden drop in orders might mean technical issues on your website or a new complex checkout process. Once you find the problems, study the reasons behind them to solve them promptly.
3. Visualize Insights
To make the most of your data, visualize it. Use charts, graphs, heat maps, and other visual means to make complex datasets easier to understand and share.
Plus, make sure you don’t just present isolated data points. Explain your findings about the trends and patterns you spotted.
How to Optimize Your Business Based on Shopify Data Analytics
Shopify Analytics apps let you go beyond simply monitoring your store. They provide you with the data necessary for optimizing various processes. Just look at how you can improve business with Shopify Analytics:
Sales and Revenue
Leverage Shopify sales reporting to improve your bottom line. In particular, consider the following strategies:
- Analyze traffic sources and conversion funnels. Study which channels bring the most traffic and identify any bottlenecks within your conversion funnel. Look where your website visitors drop off, for example, a product or checkout page. Optimize these areas with detailed and clear product info, compelling CTAs, and a simple checkout experience.
- Experiment with Shopify A/B testing. Try out different product page layouts, call-to-action buttons, or checkout processes. Analyze the implemented changes through Shopify Analytics and choose the variations that generate the highest conversions.
- Use product reports. Leverage product reports to identify your best-selling items and potential upselling and cross-selling opportunities. Analyze inventory for slow-moving items and consider discounting or bundling them with popular products.
Marketing and Customer Acquisition
Use built-in analytics features or Shopify Analytics API to improve your marketing and customer acquisition efforts. Here’s what you can do:
- Leverage campaign reports. Analyze your marketing campaign performance on various channels, like social media, email, and others. Find out which channels are most effective in driving traffic and conversions to optimize your marketing spend ing.
- Analyze customer demographics and behavior. Study this data to gain more insights into your target audience. Learn their age, location, interests, and purchasing preferences to create targeted marketing campaigns and offer personalized product recommendations.
- Use abandoned cart reports. Figure out why your customers abandon their carts before completing a purchase. Solve any identified issues to recover lost sales and improve checkout.
Inventory and Operations
Leverage Shopify Analytics for business growth, proper inventory management, and streamlined operations. The strategies to consider include:
- Employ inventory reports. Forecast demand and optimize stock levels by analyzing inventory reports. Prevent stockouts to avoid losing sales and reduce costs associated with keeping excess inventory.
- Analyze shipping data. Identify cost-effective and efficient shipping methods by studying shipping info through Shopify Analytics. Consider offering different shipping options based on price and delivery speed for your customers’s convenience.
- Track customer support interactions. Pinpoint recurring issues by reviewing the data from your support team. Address any problems quickly. For example, you can update your website FAQs, improve Shopify SEO, or refine product descriptions to reduce the need for support interactions.
Foster Growth with Shopify Analytics
Seems like you’ve completed our comprehensive Shopify Analytics guide and understood the significant value of the data your store generates. However, interpreting and using that information effectively can be overwhelming.
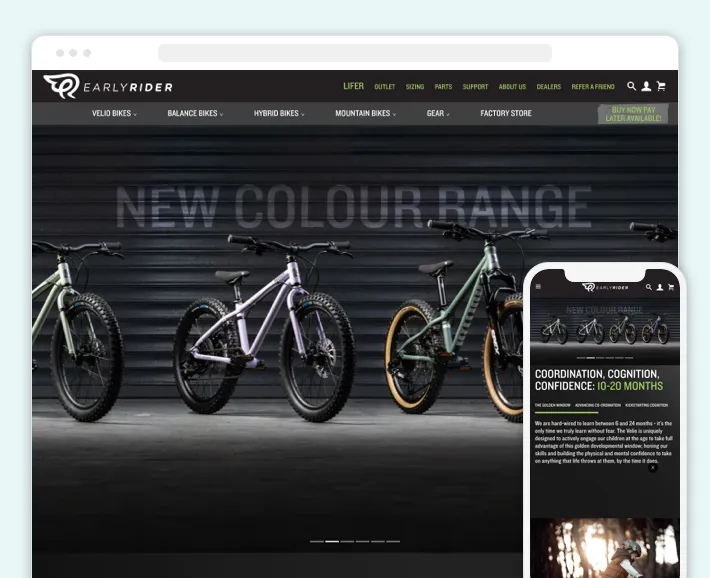
The good news is that GenovaWebArt can help your business leverage Shopify to its fullest. Whether you’re looking to boost conversions through a store redesign like we did for Early Rider or want to introduce new features like for MìLà, our team is here to assist you.
We can assure you: there’s no wrong Shopify Analytics — only misinterpretations. That’s why we provide the tools and guidance necessary for data-driven decisions that can really make a difference in your online store. After analyzing your data, GenovaWebArt skillfully executes:
- Shopify design and development
- Shopify Plus design and development
- Shopify expansion and scaling
- Or other services following your needs
Don’t wait any longer. Leverage the insights from this guide and consider booking a free consultation with our experts. We’ll discuss your specific needs to help you use the data for your Shopify business growth.
Frequently Asked Questions
What are the benefits of Shopify Analytics?
- Access to valuable insights into your store performance.
- Ability to identify bottlenecks and areas for improvement.
- Shopify store optimization using data-driven decisions.
- Improved marketing and customer acquisition strategies.
- More effective inventory management and operations.
